


In our last update, we shared how three community-based groups; Badilisha Mtaa from Kiambiu, BRICS from MotherLand and Kinyago United from Kinyago, worked together to identify areas in their neighborhoods most affected by flooding and extreme heat. Now, let’s talk about why this matters and how it’s helping Nairobi plan better for climate risks. Computer-generated maps, also called GIS maps, use satellite images and big data to show areas at risk. But while useful, they don’t always capture what only local residents see: the corners that always flood after a light rain, or the open spaces that trap heat because there’s little to no tree cover. That’s where community-led mapping becomes powerful.
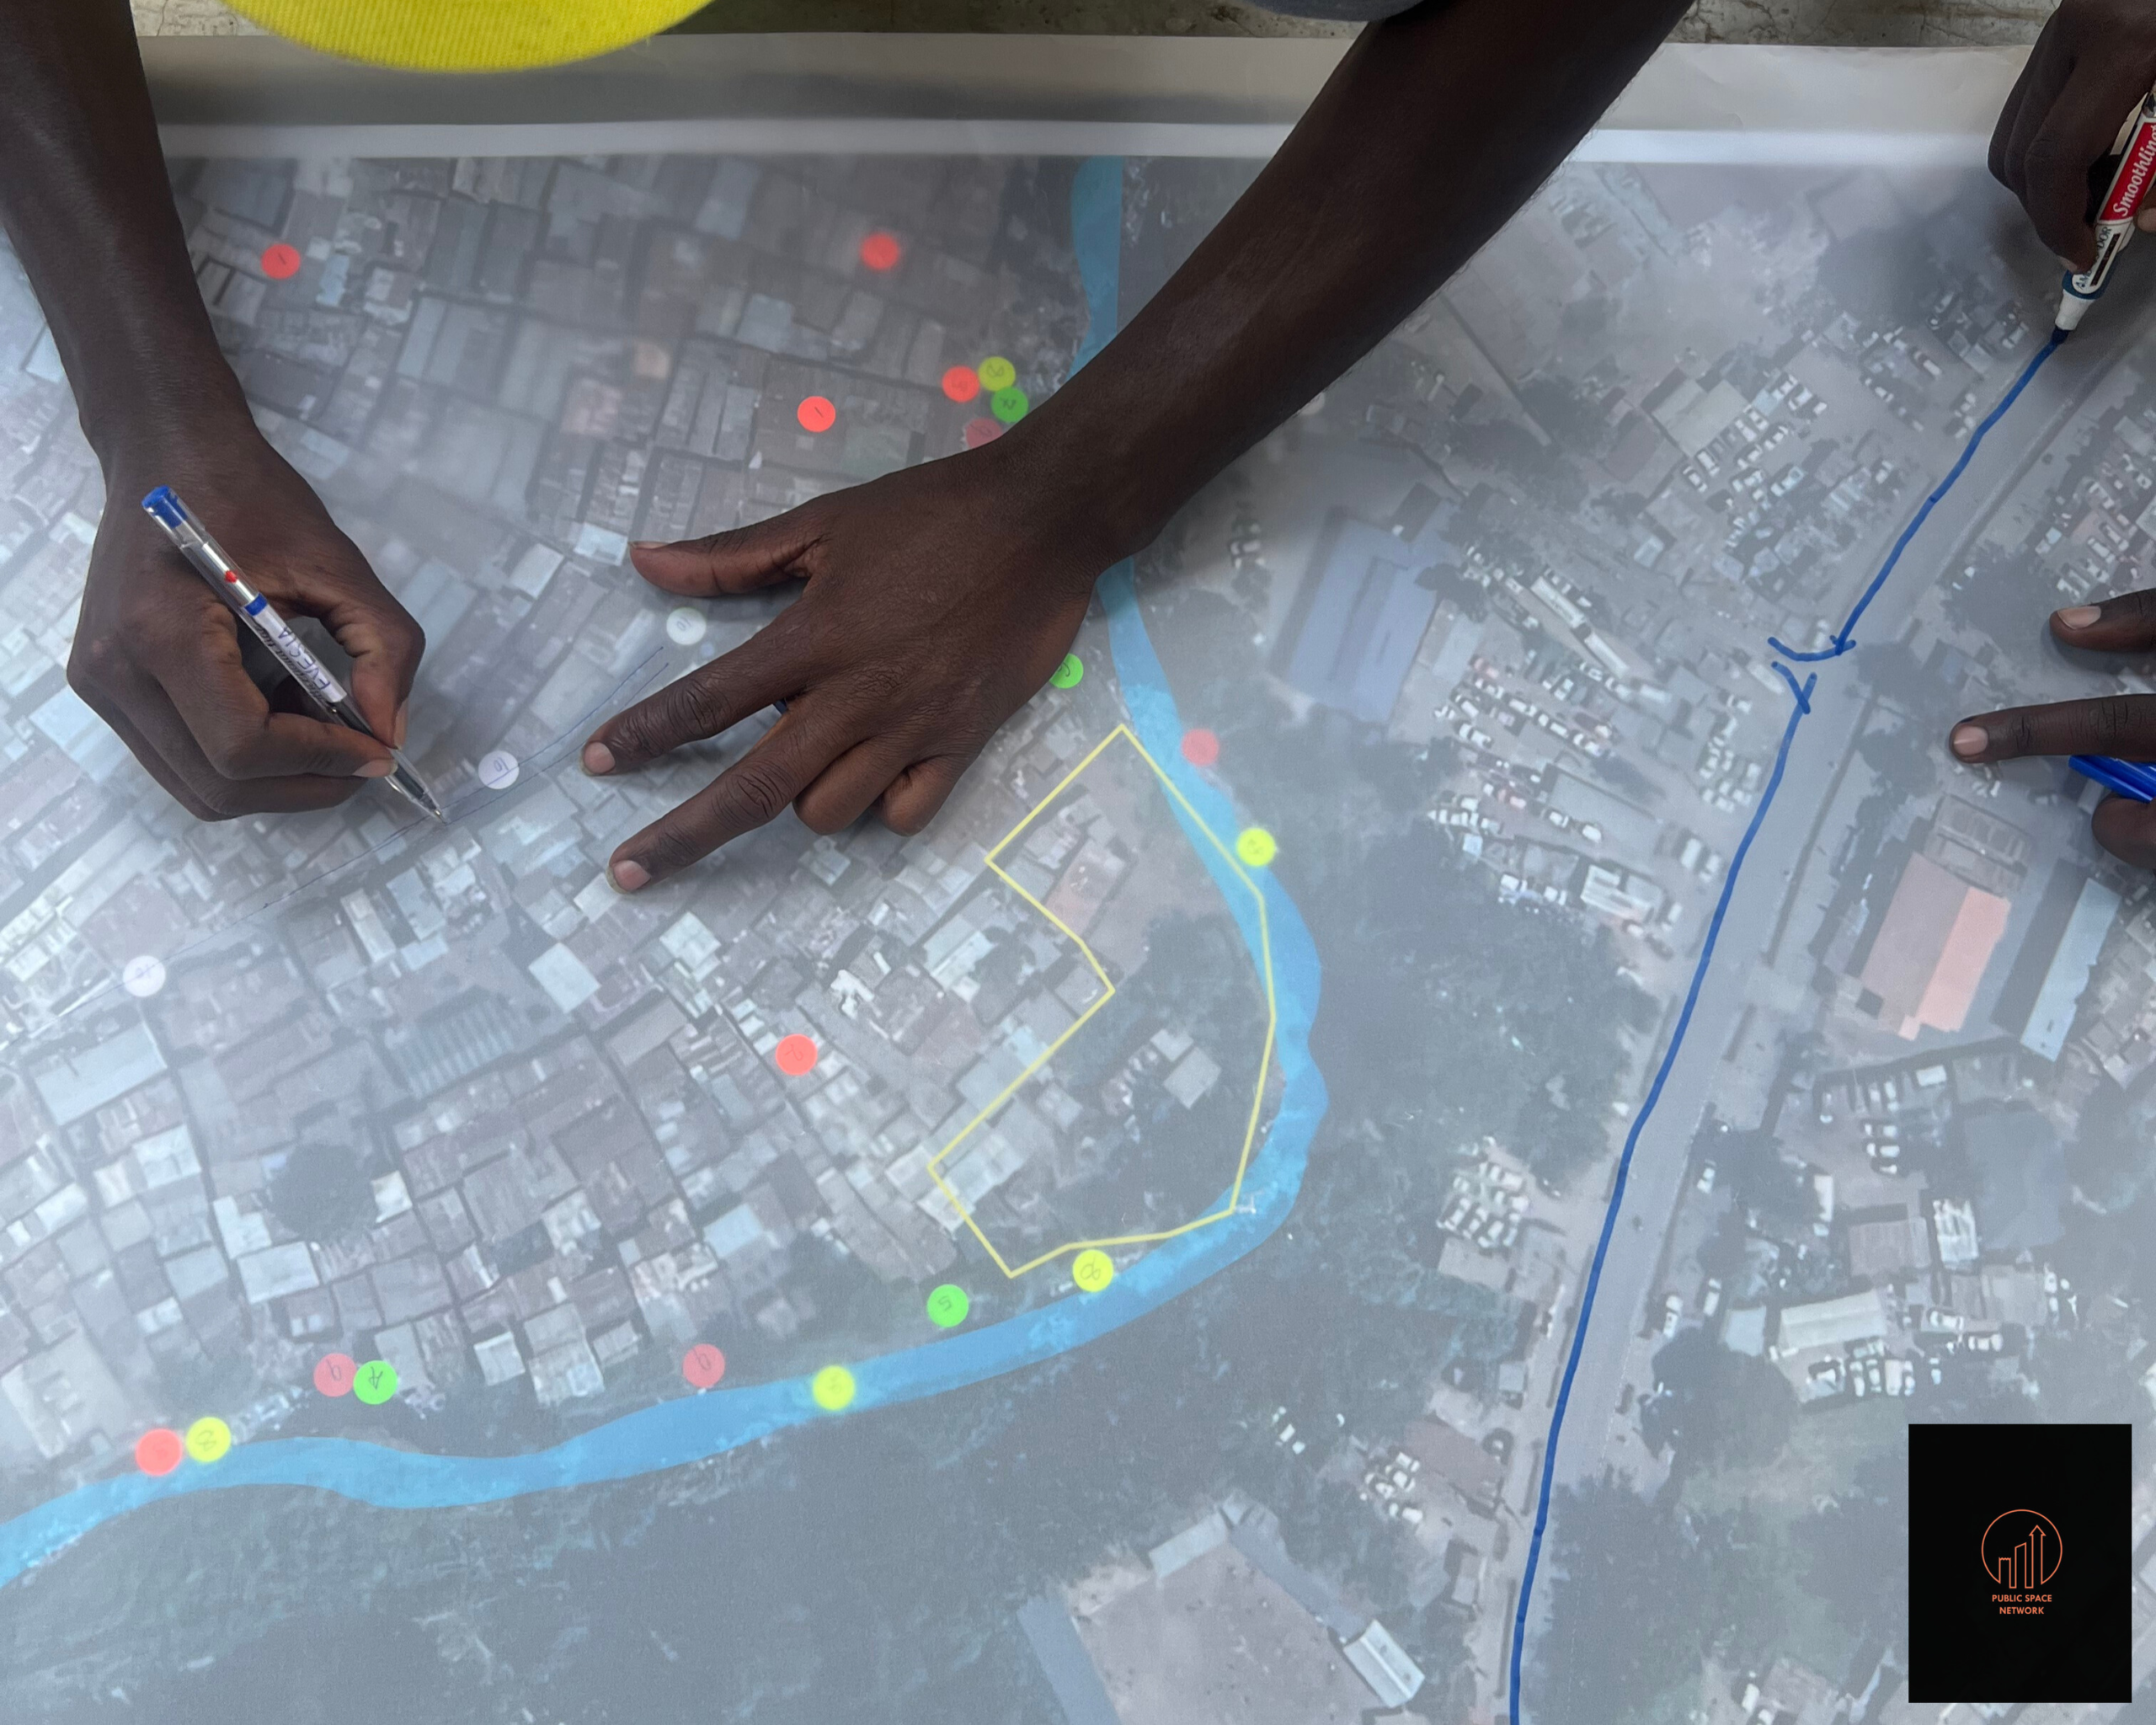
These groups walked their own streets, marked danger zones and shared the stories behind those places, these are the the lived experiences that don’t show up in data. And with tools like KoboCollect. a mobile app used to take notes, record locations and snap photos, they didn’t just draw their maps, they turned them into organized digital records that can be layered onto GIS maps. What was the result? A fuller, clearer picture of climate risks. A picture that urban planners and local leaders can actually use to guide action. More than that, this kind of work builds trust. It gives residents new skills, strengthens local collaboration, and creates a sense of ownership over the future. When people help map out the challenges, they’re more ready to shape the solutions. This is the kind of impact that speaks to those who believe in real, community-led transformation that lasts for years to come.
When people help map out the challenges, they’re more ready to shape the solutions